For decades, the single most pressing issue for water utilities has been the health of buried water pipes. Water loss from pipe failure is a significant challenge for all utilities. Every year, utilities lose between 20% to 60%, and that loss occurs after the expense of sourcing, treating, and distributing the water. The cost doesn’t stop at the water itself. Burst pipes damage property and roads, disrupt neighborhoods, contribute to unnecessary greenhouse gas emissions, and tarnish public trust.
With limited budgets and failing infrastructure, utility leaders must make difficult choices about where to act first. That’s where risk prediction comes in. Utilities employ a variety of approaches to prioritize asset management based on predicted risk. These approaches are outlined below with their respective strengths and weaknesses.
See other case studies from utilities using AI in the field →
1. Asset Condition Assessment Combined with Failure Likelihood Scoring
Method:
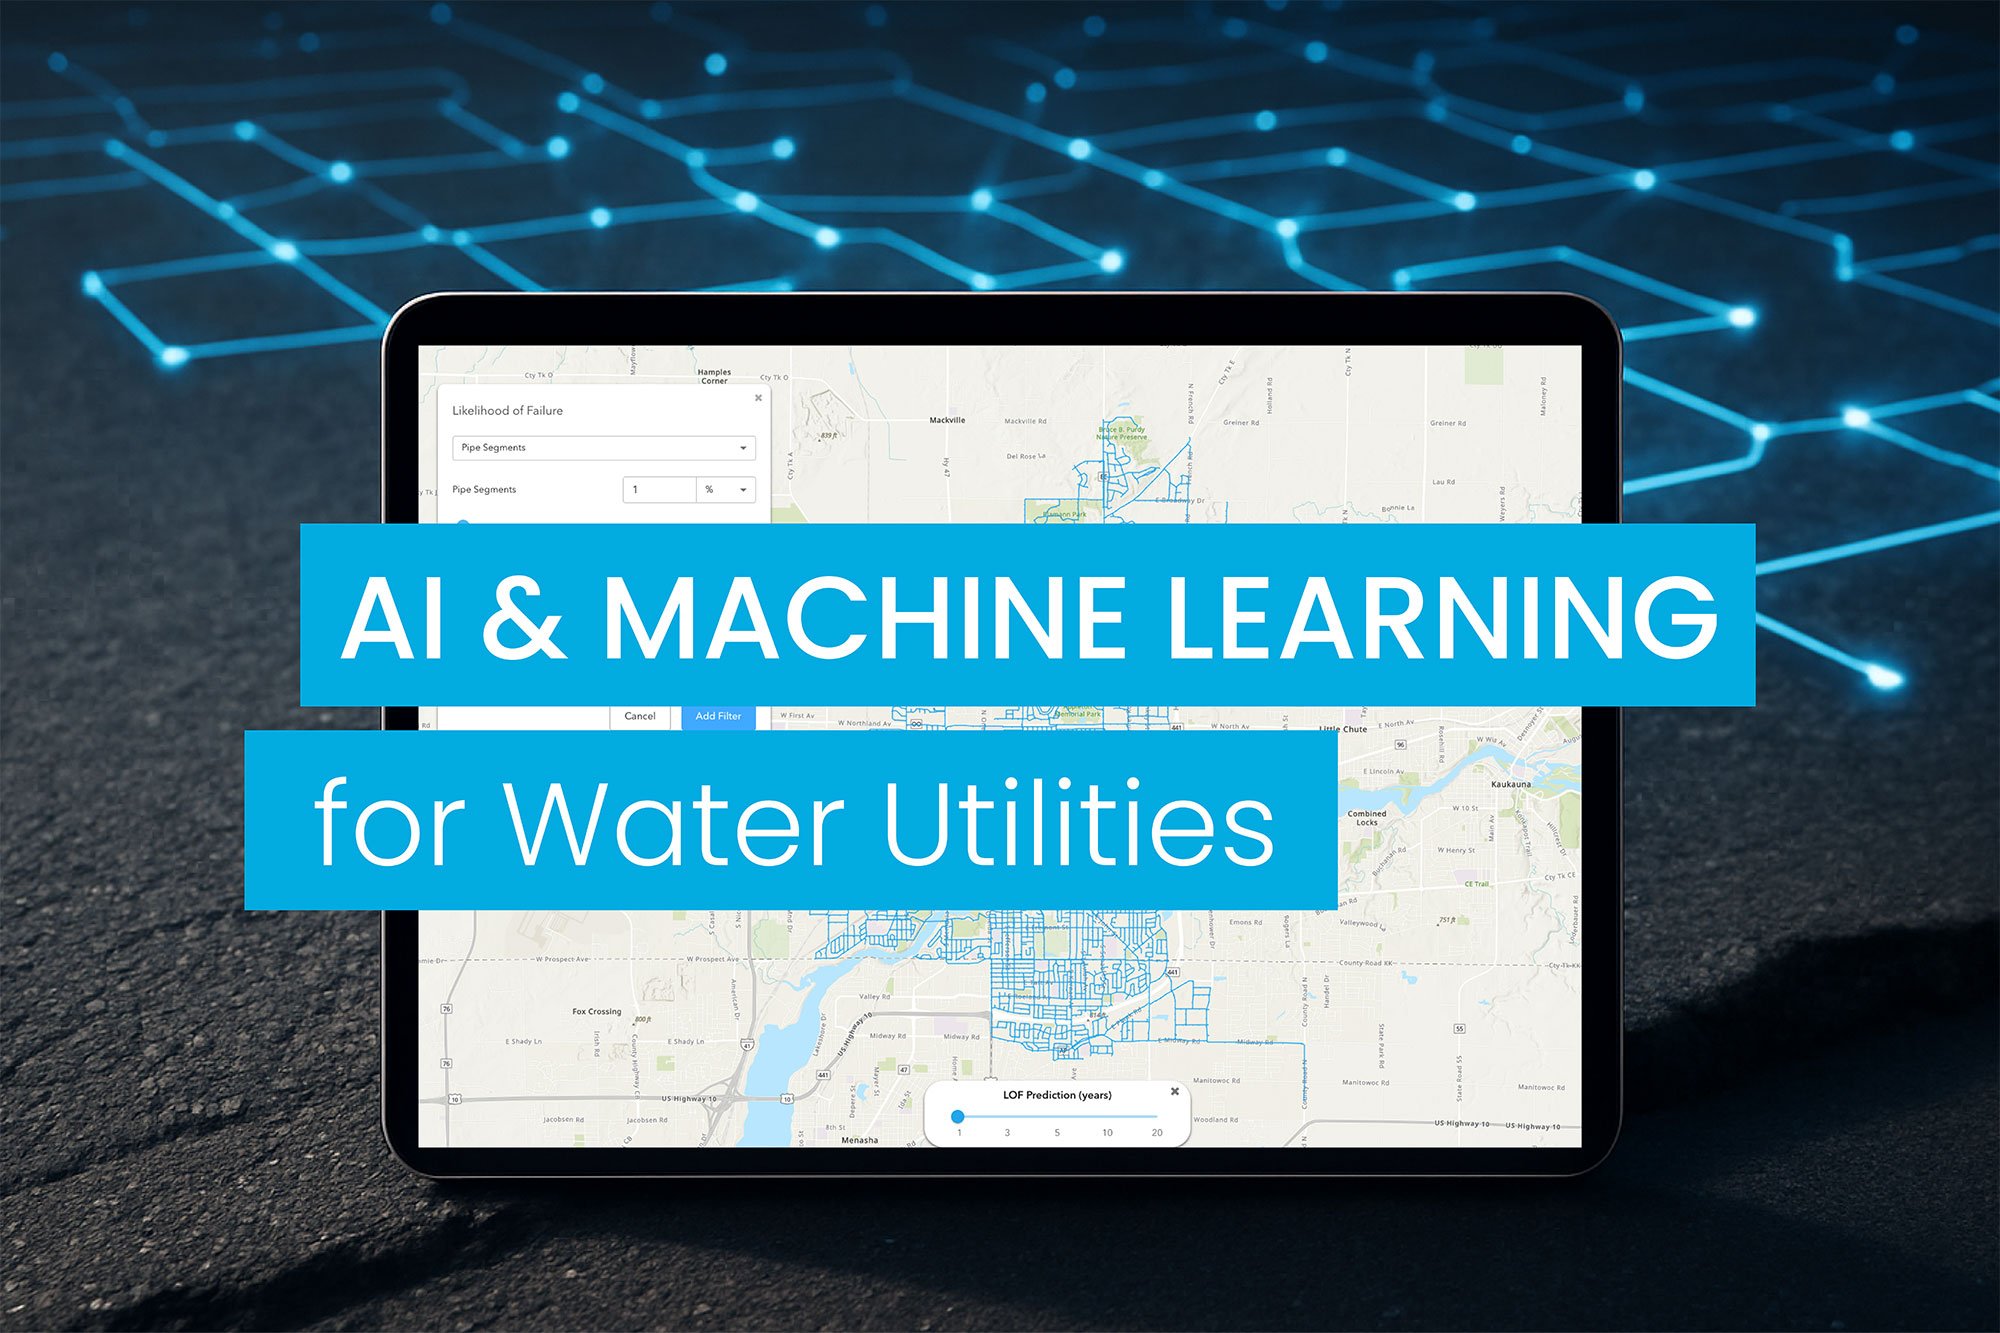
- Combine field inspections, condition ratings, and engineering judgment to assign each asset (pipes, pumps, valves) a “likelihood of failure” (LoF) score.
- Often paired with “consequence of failure” (CoF) to produce a risk score = LoF × CoF.
Strengths:
- Simple, well-understood, and fits regulatory asset management frameworks.
- Works with limited historical data.
Weaknesses:
- Subjective if based heavily on staff opinion.
- Misses subtle risk patterns without deep data analysis.
Best for: Smaller to mid-size utilities or as a first step toward predictive modeling.
2.Statistical Analysis
Method:
- Use statistical failure models (e.g., Weibull distribution, exponential decay, remaining useful life) to estimate the probability of failure based on asset age, material, environment, and historical break rates.
Strengths:
- Quantitative, data-driven, and adaptable to different asset classes.
- Good balance between rigor and feasibility.
Weaknesses:
- Requires several years of good-quality failure records.
- May oversimplify complex, multi-factor failures.
Best for: Utilities with a decade+ of work orders and failure history.
3. Predictive Modeling using AI/Machine Learning
Method:
- Train machine learning model algorithms (e.g., random forest, gradient boosting, neural networks) on asset, operational, and environmental data sets to predict pipe failures.
- Can integrate SCADA data, soil corrosivity maps, weather patterns, and pipe-level attributes.
Strengths:
- Can uncover hidden patterns and non-linear relationships.
- Often more accurate than traditional models once tuned.
- Can predict failures in pipes with no previous breaks.
Weaknesses:
- Needs consistent logging of pipe failures for model training.
- This approach requires specialized skills and ongoing model maintenance.
Best for: Utilities with technology-forward leadership.
4. Hydraulic and Water Quality Simulation Risk Modeling
Method:
- Use hydraulic network models (e.g., EPANET, InfoWater) to simulate how failures would impact service levels, pressure, and water quality.
- Risk is assessed by combining failure probability with modeled service and quality impacts.
Strengths:
- Directly connects asset condition to customer service impact.
- This is useful for scenario planning and emergency response planning.
Weaknesses:
- Requires a calibrated network model.
- Focused on impact modeling rather than failure prediction itself.
Best for: Utilities wanting to prioritize based on service-criticality rather than just likelihood of failure.
5. GIS-Based Multi-Criteria Risk Mapping
Method:
- Overlay spatial datasets (pipe age, soil corrosivity, leak history, proximity to critical facilities) in GIS to create risk “heat maps.”
Strengths:
- Visually intuitive for decision-makers and field crews.
- Can integrate with work order systems and capital planning.
Weaknesses:
- Often more descriptive than predictive.
- Weighting of criteria can be subjective.
Best for: Communicating risk to stakeholders and identifying priority areas.
How the 5 Risk Prediction Methods Stack Up
|
Method |
Data Requirements |
Accuracy |
Cost |
Practicality |
Typical Utility Size |
|
Asset Condition + LoF/CoF |
Low |
Low–Medium |
Low |
High |
Small–Medium |
|
Statistical Analysis |
Medium |
Medium |
Medium |
Medium–High |
Medium–Large |
|
AI /Machine Learning |
Medium–High |
High |
Medium–High |
Medium |
All sizes |
|
Hydraulic Impact Modeling |
Medium–High |
Medium |
Medium–High |
Medium |
Medium–Large |
|
GIS Risk Mapping |
Medium |
Medium |
Medium |
High |
All sizes |
Side-by-Side Comparison
Every utility operates with limited resources, and every utility deals with infrastructure failures. But not every utility predicts it well. The better you can predict risk to prioritize resources, the better you can prevent damage, reduce cost, and preserve trust.
Among all five risk prediction methods – Machine learning provides the highest accuracy for predicting failures. It works by applying multiple algorithms to lots of data. If you are ready to get more out of your data, start the process by improving its quality and quantity. Then, partner with experts like VODA.ai to unlock the best insights that help you stay ahead of failure.
This is the second article in our AI for Utilities series – where we break down what AI and machine learning really means, how it works, how it helps, and what results utilities are seeing. We also bust the myths around this often mystified technology.
🔔 Subscribe to our blog to hear what’s working – and what’s next.